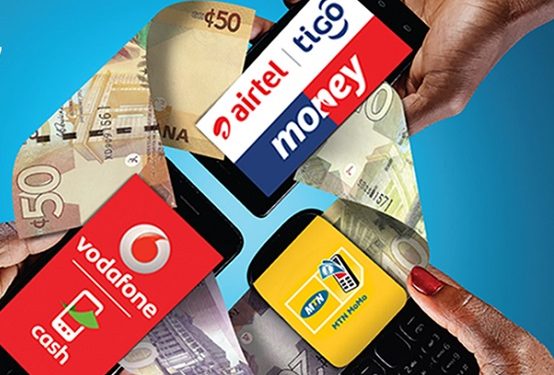
Mobile Money Transactions Soar to GHS 1.77 Trillion in First Eight Months of 2024
The September 2024 Summary of Economic and Financial Data released by the central bank reveals fluctuating monthly transaction values.
- Advertisement -
The total value of mobile money transactions in Ghana surged to GH¢1.775 trillion in the first eight months of 2024, according to data from the Bank of Ghana. This represents a striking 72% increase from GH¢1.031 trillion recorded during the same period in 2023, underscoring the rapid growth of digital financial services in the country.
The rise in transaction volumes highlights the increasing role of mobile money in deepening financial inclusion across Ghana, as more individuals and businesses leverage mobile platforms for payments, savings, and transfers. However, despite this significant expansion, the performance of the country’s Electronic Transaction Levy (E-Levy) remains underwhelming, raising questions about the efficiency of revenue collection mechanisms.
- Advertisement -
The September 2024 Summary of Economic and Financial Data released by the central bank reveals fluctuating monthly transaction values. In January 2024, mobile money transactions stood at GH¢198.4 billion, dipping slightly to GH¢195.8 billion in February, before declining further to GH¢181.9 billion in March.
- Advertisement -
April saw a rebound to GH¢203.0 billion, followed by a continued rise to GH¢234.3 billion in May. Transaction values dipped slightly again in June to GH¢224.0 billion, before climbing steadily in July (GH¢264.9 billion) and August (GH¢273.6 billion).
The persistent growth in mobile money usage raises questions about the modest revenue impact from the E-Levy, introduced to tax electronic transactions. Despite the soaring transaction volumes, the levy has not generated the expected returns, suggesting potential challenges with enforcement, compliance, or consumer behavior shifts aimed at minimizing tax liabilities.
- Advertisement -
As Ghana’s digital economy continues to expand, the gap between transaction volumes and tax revenue will remain a critical area of focus for policymakers seeking to balance financial inclusion with effective taxation.
| MONTH | 2023 | 2024 |
| January | 130.1bn | 198.4bn |
| February | 134.0bn | 195.8bn |
| March | 147.5bn | 181.9bn |
| April | 138.8bn | 203.0 bn |
| May | 159.7bn | 243.4bn |
| June | 149.4bn | 224.0bn |
| July | 169.6bn | 264.9bn |
| August | 161.8bn | 273.6bn |
Source:norvanreports.com
- Advertisement -


