

Can MTNGH maintain its dominance with growth and value strategy?
This analysis examines the potential dual identity (Growth and Valued stock) posed by Scancom (MTN Ghana) Plc. over the past six years of being listed on the Ghanaian Stock Market. To do this, we used various Key Performance Indicators as measure of being either a growth or a valued firm. In addition, we conducted industry analysis and valuation to reaffirm the possibility of its picking a side among the identities of interest in the study.
Overview
In the ever-changing world of the stock market, Scancom Plc (MTN Ghana) stands out as a unique case on the Ghanaian stock market. This leading telecommunications company, the largest ever listed on the Ghanaian Stock Exchange (GSE), defies traditional classifications. MTN exhibits a blend of characteristics typically associated with both growth and value stocks. This in-depth analysis aims to understand the strong performance of MTN and explore the complexities behind its unique position in the market landscape.
The growth trajectory of the Telecommunication firm is characterized by a sequence of steady and significant rises in revenue, indicating not only the strong market presence, but also a potential for significant future expansion and a track record of dominating or outperforming the Ghanaian stock market over the period. A thorough examination of its ever-growing earnings per share (EPS), revenue growth rates, and market share development provides a clear and comprehensive picture of a business that is well-positioned to take advantage of major growth prospects in the rapidly changing telecoms industry.
On the other hand, fundamental metrics reveal the market share price as potentially undervalued relative to its intrinsic value, aligning with the principles of value investing. The examination of the price-to-earnings (P/E) ratio suggests a fine distinctive perspective on the market valuation relative to the earnings of the company. At the same time, the dividend yield and book value further highlight the blend of growth and value attributes within the company. Moreover, a deeper exploration of the financial stability of MTN GH adds more information to its dual identity. A comprehensive analysis of debt-to-equity ratios, current ratios, and cash flow analysis offers much insights into its resilience in navigating economic uncertainties, further strengthening its dual identity.
Scancom Plc (MTN Ghana) emerges not only as a compelling case study but as a dual challenging traditional investment categorization. For investors looking for a more sophisticated approach to portfolio construction, the company offers a diverse prospect by skillfully blending the traits of both growth and value equities. As the market develops, it is critical to continuously observe how MTN GH skillfully balances these two functions. This will give an in valuable insights into possible investment strategies in the dynamic financial landscape.
Key Performance Indicators
In 2018, MTN registered a Price-to-Book (P/E) value ratio of 11.8 at the end of the first year of being listed on the GSE. This fell to 3.8 in 2022 and then rose to 4.7 in 2023. Accordingly, the Price-to-Book (P/B) ratio declined from 4.3 in 2018 to 2.0 in 2022, and currently at 2.2 in 2023.
The Price-to-Cashflow (P/CF) ratio fell significantly from 6.5 in 2018 to 2.4 in 2023, indicating a shift towards a more undervalued or even value-oriented metrics. The Price-to-Sales (P/S) ratio declined from 2.5 in 2018 to 1.2 in 2022 and subsequently rose to 1.4 in 2023, indicating potential undervaluation or a value proposition. The Return on Equity and Return on Asset remained relatively stable throughout the years, indicating the consistency of MTN in maximizing the profitability of shareholders, a characteristic often seen in value stocks.
Based on the analysis of the provided data, MTN Ghana exhibits characteristics of both growth stock and value stock. The decreasing trend in the P/E, P/B, P/S, P/CF and yearly increases in DPS indicates a move towards value territory. However, the positive PEG or consistent YoY rise earnings per share and revenue growth rate also indicate potential growth prospects.
| Year | P/E | P/B | PEG | P/CF | P/S | ROE | ROA | EPS | DPS | Pay-out | Retention |
| 2018 | 11.8 | 4.3 | – | 6.5 | 2.5 | 31.3% | 17.9% | 0.067 | 0.02 | 29.9% | 70.1% |
| 2019 | 6.9 | 3.3 | 13.1 | 3.6 | 1.9 | 44.7% | 12.6% | 0.102 | 0.06 | 58.8% | 41.2% |
| 2020 | 5.7 | 2.5 | 52.5 | 3.3 | 1.4 | 41.8% | 9.8% | 0.113 | 0.08 | 70.8% | 29.2% |
| 2021 | 6.8 | 3.4 | 15.4 | 3.5 | 1.9 | 46.0% | 11.5% | 0.163 | 0.085 | 52.1% | 47.9% |
| 2022 | 3.8 | 2.0 | 9.0 | 2.0 | 1.2 | 50.0% | 12.9% | 0.232 | 0.124 | 53.4% | 46.6% |
| 2023 | 4.7 | 2.2 | 15.6 | 2.4 | 1.4 | 46.2% | 12.9% | 0.301 | 0.255 | 84.7% | 15.3% |
Business Model & Revenue Growth
The impressive revenue growth of MTN shows no sign of slowing down. In 2023, it recorded an exceptional revenue growth, reaching an impressive rate of 34.6%, following a strong 36.14% increase in the third quarter. Over the span of six years since 2018, MTN has achieved a remarkable Compound Annual Growth Rate (CAGR) of 30%, growing its revenues from GHs 9.9 billion to GHs 13.3 billion in 2023. Looking ahead, projections show a conservative estimate of 26% revenue growth by year end 2024 and gradually rising in the following years to align with the long-term economic growth rate represented by the 10-year Treasury Bond yield of the Government of Ghana securities.
The revenue streams, derived from its offerings in Data, Voice, Momo, and Digital services to customers and merchants across the country, are linked to the state of the e-commerce and telecommunications sectors. After the outbreak of the covid pandemic in 2020, the already flourishing telecom company boomed, and not surprisingly, digital payments closely followed the same growth pathway which led to about 16.3% growth in the number of subscribers to the Momo services, increasing the revenue generated from the Momo service by 32.2% in the year 2020 and a 6-year CAGR in Service revenue of 29.91%.
However, even without the boost given by lockdowns, e-commerce and digital payments were already well-established concepts in the everyday lives of people, and while they could not be described as mature industries, neither they could be considered youngsters. MTN itself was already a dominant player in the telecommunication industry before the pandemic, with the latest only helping to strengthen and accelerate the adoption of digital services and its position in the Ghanaian market.
| Year | Revenue | NOPAT | FCFF | ROIC | Revenue Growth | Income Growth | Sales to Inv. Capital |
| 2018 | 4,218,847 | 754,676 | 753,549 | 19.8% | 23.2% | 5.03% | 110.7% |
| 2019 | 4,778,634 | 1,253,153 | 1,745,874 | 13.2% | 13.3% | 66.05% | 50.3% |
| 2020 | 6,033,428 | 1,395,694 | 2,019,329 | 10.3% | 26.3% | 11.37% | 44.5% |
| 2021 | 7,723,259 | 2,007,349 | 1,876,382 | 12.1% | 28.0% | 43.82% | 46.7% |
| 2022 | 9,916,109 | 2,855,801 | 2,186,476 | 13.9% | 28.4% | 42.27% | 48.4% |
| 2023 | 13,349,471 | 3,982,250 | 2,362,734 | 14.2% | 34.6% | 39.44% | 47.7% |
Growth Trajectory Assessment
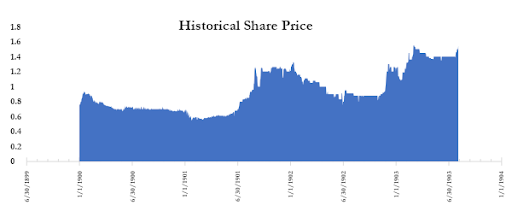
The strong market performance is evident in various metrics. Over the past 6-years, MTN achieved a Compound Annual Growth Rate (CAGR) of 21.1% for revenue and 33% for net income. This translated to a significant increase in profitability with EPS growing at a CAGR of 28.45% in 2023. Dividend Per Share have seen an even more impressive rise, with a CAGR of 49.69%. The financial health of the company is further bolstered by a CAGR of 39.41% for Total Assets and 23.66% for Equity. The market share price responded accordingly with an impressive CAGR of 10.83% by the end of 2023.
| Year | Turnover | EBITDA | PBT | Net Income | Equity | Asset | EPS | DPS | Share Price |
| 2018 | 4,218,847 | 1,587,629 | 1,443,374 | 718,512 | 2,410,392 | 4,216,880 | 0.067 | 0.020 | 0.75 |
| 2023 | 13,349,471 | 7,800,469 | 5,589,707 | 3,982,250 | 8,619,074 | 30,958,441 | 0.301 | 0.225 | 1.39 |
| CAGR | 21.17% | 30.39% | 25.31% | 33.03% | 23.66% | 39.41% | 28.45% | 49.69% | 10.83% |
Leverage and Risk Assessment
The current ratio, a measure of the ability to meet short term obligations, has fluctuated over the years, ranging from 0.96 to 1.60. While 2021 indicated a better liquidity position, the metric dipped again in 2023 to 1.09, which is still considered adequate for managing short-term debt.
On the other hand, the debt-to-equity ratio has shown a upward and downward trend, reaching 3.26 in 2020 and steadily decline to 2.59 at the end of year 2023. This indicates a gradual control on the reliance on debt financing which can potentially heighten financial risk. While leverage can be a tool for growth, excessive leverage can strain financial stability and erode profitability.
The Cashflow to Net income ratio, which measures the ability of a firm to convert earnings into cash, has steadily improved and remained above the ideal ratio of 1 in recent years. This positive trend highlights the ability of MTN to generate cash flow relative to its net income, which is vital for sustainable operations and growth.
However, the fluctuations in the Cashflow coverage ratio indicates some level of financial risk. This may suggest a need for potential refinancing or operational restructuring to increase cash flow and enhance the capacity of MTN to cover interest payments which will contribute to the overall financial health of MTN over time.
| Year | Current ratio | Debt-to-Equity | Cashflow to Net Income | Cashflow Coverage |
| 2018 | 1.00 | 0.75 | 2.14 | 0.89 |
| 2019 | 0.96 | 2.55 | 2.04 | 0.36 |
| 2020 | 0.96 | 3.26 | 1.83 | 0.23 |
| 2021 | 1.60 | 3.02 | 2.13 | 0.32 |
| 2022 | 1.05 | 2.86 | 2.07 | 0.36 |
| 2023 | 1.09 | 2.59 | 1.98 | 0.35 |
Fiscal Year 2023 Performance
The fiscal year 2023 saw Scancom Plc (MTN Ghana) achieve total revenues of GHs 13.35 billion, marking a 34.6% increase from the previous year. While non-service revenue for the year amounted to about GHS 874 million (up by 32.5%), Data and Voice service revenue, a critical component of MTN’s business model, also experienced growth of 50.9% YoY (driven by 21.9% growth in MB consumed by active users per month and the initiative in data pricing implemented) and 9.0% YoY, reaching GHs 5.8 billion and 3.6 billion respectively. Momo service revenue followed, registering a growth rate of 48.8% to GHs 2.9 billion. The decline in digital revenue over the years slowed (contributed 1.0% to service revenue), with a decrease of 4.7% YoY to GHS137.4 million, reflecting the impact of the massive performance in the half year of 2023, where digital revenue grew sequentially by 15.6% over the first quarter 2023, supporting the optimism for a revenue growth continuation in 2024 and posing an increase of 28.6% YoY in the number of active digital subscribers, reaching a total of 4.6 million. This reflects the efforts to enhance customer experience, as well as to rationalise the digital product portfolio.
MTN Ghana blocked 5.4 million SIMs that were not registered with the Ghana card in May 2023, in compliance with directives from the NCA. Since then, 0.6 million SIMs of the blocked cohort have been re-registered, bringing the total number of outstanding disconnected SIMs to 4.8 million as at the end of December 2023. As a result, the subscriber base decreased by 6.3% to 26.8 million which inevitably induced the revenue generated at the end of the year 2023.
Fourth Quarter Highlights and Challenges
The fourth quarter of fiscal year 2023 ended on a high note for Scancom Plc (MTN Ghana), with total revenues reaching GHS 13 billion, 35% increase year on year. Data services continued to be a strong driver, with revenues of GHS 5 billion, up about 51% from the previous year. Earnings Before Interest, Tax, Depreciation and Amortization for the quarter saw a significant jump of 40% to GHS 7.8 billion.
Following current spillovers from the Ghanaian economy and the world at large, Net finance cost increased by 81.1% YoY to GHS486.2 million due to a relatively higher finance cost compared to finance income. Finance cost increased by 63.3% YoY primarily due to currency depreciation, which resulted in unrealised losses on dollar-denominated capex, and high levels of inflation and interest rates on lease costs. The finance cost (up by 63.3% YoY due to cedi depreciation) was partially offset by a 40.2% YoY increase in finance income, primarily from gains on surplus cash invested in call and fixed-term deposits. Depreciation and amortization increased by 43.9% YoY to GHS1.7 billion. Despite the challenges above, Net income for the year ended 2023 increased by 39.4% YoY to GHS4.0 billion.
Economic Outlook
The fiscal year of 2023 was characterized by significant macroeconomic challenges, including currency depreciation against major trading currencies and elevated inflation rates. Despite a reduction in inflation from 54.1% in December 2022 to 23.2% in December 2023, it remained persistently high throughout the year, averaging 40.2% annually compared to the 31.5% average in 2022. According to the Bank of Ghana interbank report, the Ghanaian cedi experienced a depreciation of 38.5% against the US Dollar. In response to the prevailing economic conditions, the Central Bank tightened its monetary policy. Moreover, the Ghanaian government initiated a Domestic Debt Exchange Programme (DDEP) as part of fiscal reforms, which was a prerequisite for securing the USD3.0 billion Extended Credit Facility support from the IMF. Consequently, the returns on treasury bonds decreased, and the maturity dates were extended. The combined impact of these measures resulted in increased credit costs, limited access to new capital, heightened pressure on consumer spending, and elevated operating expenses for businesses
Industry
These pictorial trends occurred in the telecommunication industry as at the end of December 2023 with an estimated country population of 33 million. It presents information on Mobile Voice, Fixed Line, Mobile Money Coverage, as well as Mobile Data subscriptions for the year under review.
Projections
The analysis assumed MTN’s revenue margin will remain stable in the coming years, hovering around 26%. Meanwhile, EBITDA will rise from 7.8 billion in 2023 to 23.5 billion by 2028, as a consequence of minor reinvestments for growth and consequent greater profitability for MTN, which is expected to achieve a higher Profit Before Tax around 15.5 billion by 2028.
Positioned as value-oriented firm with growth competencies, MTN is steadfastly focused on elevating stakeholder profitability through sustained growth initiatives and consequent increase of heavy reinvestments, we can expect MTN to start delivering solid and consistent free cash flows to the firm (FCFF) in the coming years.
In the past, the FCFF has been highly commendable even though several acquisitions made every now and then posed a major impact, however, after the adoption of more conservative capital allocation policies, in 2023 MTN registered FCFF close to GHS 2.4 billion and we can expect the company to deliver FCFF of about GHS 4 billion by 2028.
| Historical | Forecast | |||||||
| Variable | 2021A | 2022A | 2023A | 2024P | 2025P | 2026P | 2027P | 2028P |
| Revenue | 7,723,259 | 9,916,109 | 13,349,471 | 16,820,333 | 21,193,620 | 26,703,961 | 33,646,991 | 42,395,209 |
| EBITDA | 4,249,384 | 5,563,655 | 7,800,469 | 9,327,970 | 11,753,242 | 14,809,085 | 18,659,448 | 23,510,904 |
| PBT | 2,848,638 | 4,096,520 | 5,589,707 | 6,155,202 | 7,755,554 | 9,771,998 | 12,312,718 | 15,514,024 |
| PAT | 2,007,349 | 2,855,801 | 3,982,250 | 4,205,083 | 5,298,405 | 6,675,990 | 8,411,748 | 10,598,802 |
| FCFF | 1,876,382 | 2,186,476 | 2,362,734 | 2,643,861 | 2,958,480 | 3,310,539 | 3,704,493 | 4,145,328 |
Valuation
Applying a discount rate of 21%, calculated using the Capital Asset Pricing Model at a risk-free rate of 20% (5year average Domestic Debt Exchange Programme new Bond rate), we obtain that the present value of these cash flows is equal to GHS 17 billion or GHS 2.05 per share. Compared to the current prices of GHS 1.58 per share, MTN current market price per share is undervalued by 29.75%.
| FCFF PROJECTIONS | DISCOUNT RATE | ||||||||
| FCFF | PV | Risk free (GH 5yr DDEP Bond rate) | 20.00% | ||||||
| 2023 | 2,362,734 | Beta | 1.50 | ||||||
| 2024 | 2,643,861 | 2,185,009 | Market return (GSE) | 20.7% | |||||
| 2025 | 2,958,480 | 2,020,682 | CAPM (rate of return) | 21.05% | |||||
| 2026 | 3,310,539 | 1,868,713 | |||||||
| 2027 | 3,704,493 | 1,728,174 | DCF CALCULATIONS | ||||||
| 2028 | 4,145,328 | 1,598,203 | Perpetual growth rate (GGM) | 11.0% | |||||
| Terminal Value | 46,013,142 | PV Acc. Cashflow | 17,740,058 | ||||||
| Outstanding Shares | 13.2Bn | ||||||||
| Fair Value | 2.05 | ||||||||
| Market Price | 1.58 | ||||||||
| Upside/Downside by | 29.75% | ||||||||
Conclusion
This analysis examines the potential dual identity (Growth and Valued stock) posed by Scancom (MTN Ghana) Plc. over the past six years of being listed on the Ghanaian Stock Market. To do this, we used various Key Performance Indicators as measure of being either a growth or a valued firm. In addition, we conducted industry analysis and valuation to reaffirm the possibility of its picking a side among the identities of interest in the study.
Regarding its position as a value stock, the examination of the Price-to-Earnings, Price-to-Book and Payout ratio, valuation, coupled with the consistent payment and rise in Dividend per share over the period, positions the firm as strong value stock, aimed at delivering results to stakeholders. On the other hand, MTN’s consistent registration of growing double digit in revenue, rising earnings per share, high debt to equity and a track record of introducing new products and services, outperforming and dominating the stock market positions its more as a major growing stock, to take advantage of the new era of technology rule in the coming years.
Despite the challenging economic landscape and its spillovers on the financial market and households, given my analysis and assumptions, MTN represents a good investment opportunity at the market price of today. The blend of growth and value indicators in the future, if possible, might unlock greater value for MTN shareholders, which at the expense of more modest growth in revenues and expenditure control, will receive stable and consistent cash flows as MTN capitalizes on its growing size and leading position in the Ghanaian Telecommunication industry.
Source: Bloomberg, Ghana Stock Exchange, MTN Ghana, Annual Report Ghana, National Communication Authority, Yahoo Finance, Black Stars group, Ghana Statistical Service, Wall Street, Africa Financials, Research and Insights
The Author is a Research Analyst at Nimed Capital Limited and an Associate of the Young Investors Network.